CarbonGraph
Project Overview
Design MVP in 6 month
CarbonGraph startup has set an ambitious goal to make the world carbon neutral by 2050. To do so more companies are striving to become aware of the carbon footprint of their products. Carbon emissions occur at every step of a product's lifecycle, and thus knowing the carbon footprint of a product means collecting data from its entire supply chain from raw materials to consumers. My objective as designer was to create a Web platform for companies to discover and share the carbon footprints of their products.
My Role
Lead Product Designer
Duration
6 months
Team
Designer - Me, CEO - Samuel Anderson, CTO - Nicholas Sheahan, Head of Product - Luke Boivin
Tools Used
- Figma
- Prototyping
- Design Systems
- User Research
- User Testing
Research & Kickoff
Understanding Fundamentals and Objectives
To start designing product I need to be familiar with science behind products carbon footprint and understand fundamentals. I have conducted interviews with stakeholders and advisors to better grasp my objectives as well as did reading and research to further deepen my understanding. Here I have listed key takeaways from my research:
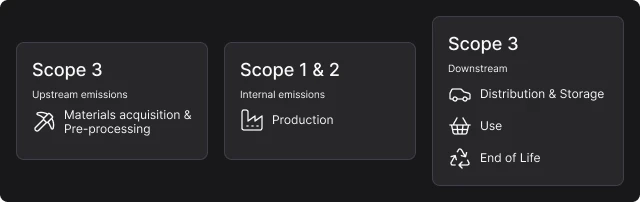
- • Carbon emissions occur at every step of product's lifecycle which is distributed in 5 steps as following according to GHG protocol:
- - Upstream - refers to emissions occurring during material acquisition and pre-processing.
- - Production - referred also as scope 1 and 2 emissions, emissions that happen during production of product.
- - Distribution & Storage - scope 3 downstream emission happening during storage and distribution of product.
- - Use - scope 3 downstream emission happening during use of product.
- - End of life - scope 3 downstream emission happening during use of product.
- • Within scope 3 companies and their product are interconnected those to calculate emission of one product we need to consider carbon footprint of other products connected by product supply chain.
- • CarbonGraph platform should help companies to search for suppliers with lowest carbon footprint and without disclosing company's production graph. CarbonGraph will serve as guarantor for accuracy of this data.
- • Users should be able to share their carbon footprint on their website as CarbonGraph embed option, therefore final data output should be exportable.
- • Companies should be able to communicate with each other and be able to request data for carbon footprint and CarbonGraph is serve as medium for these communications.
- • Need for company dashboard UI with carbon footprint metrics.
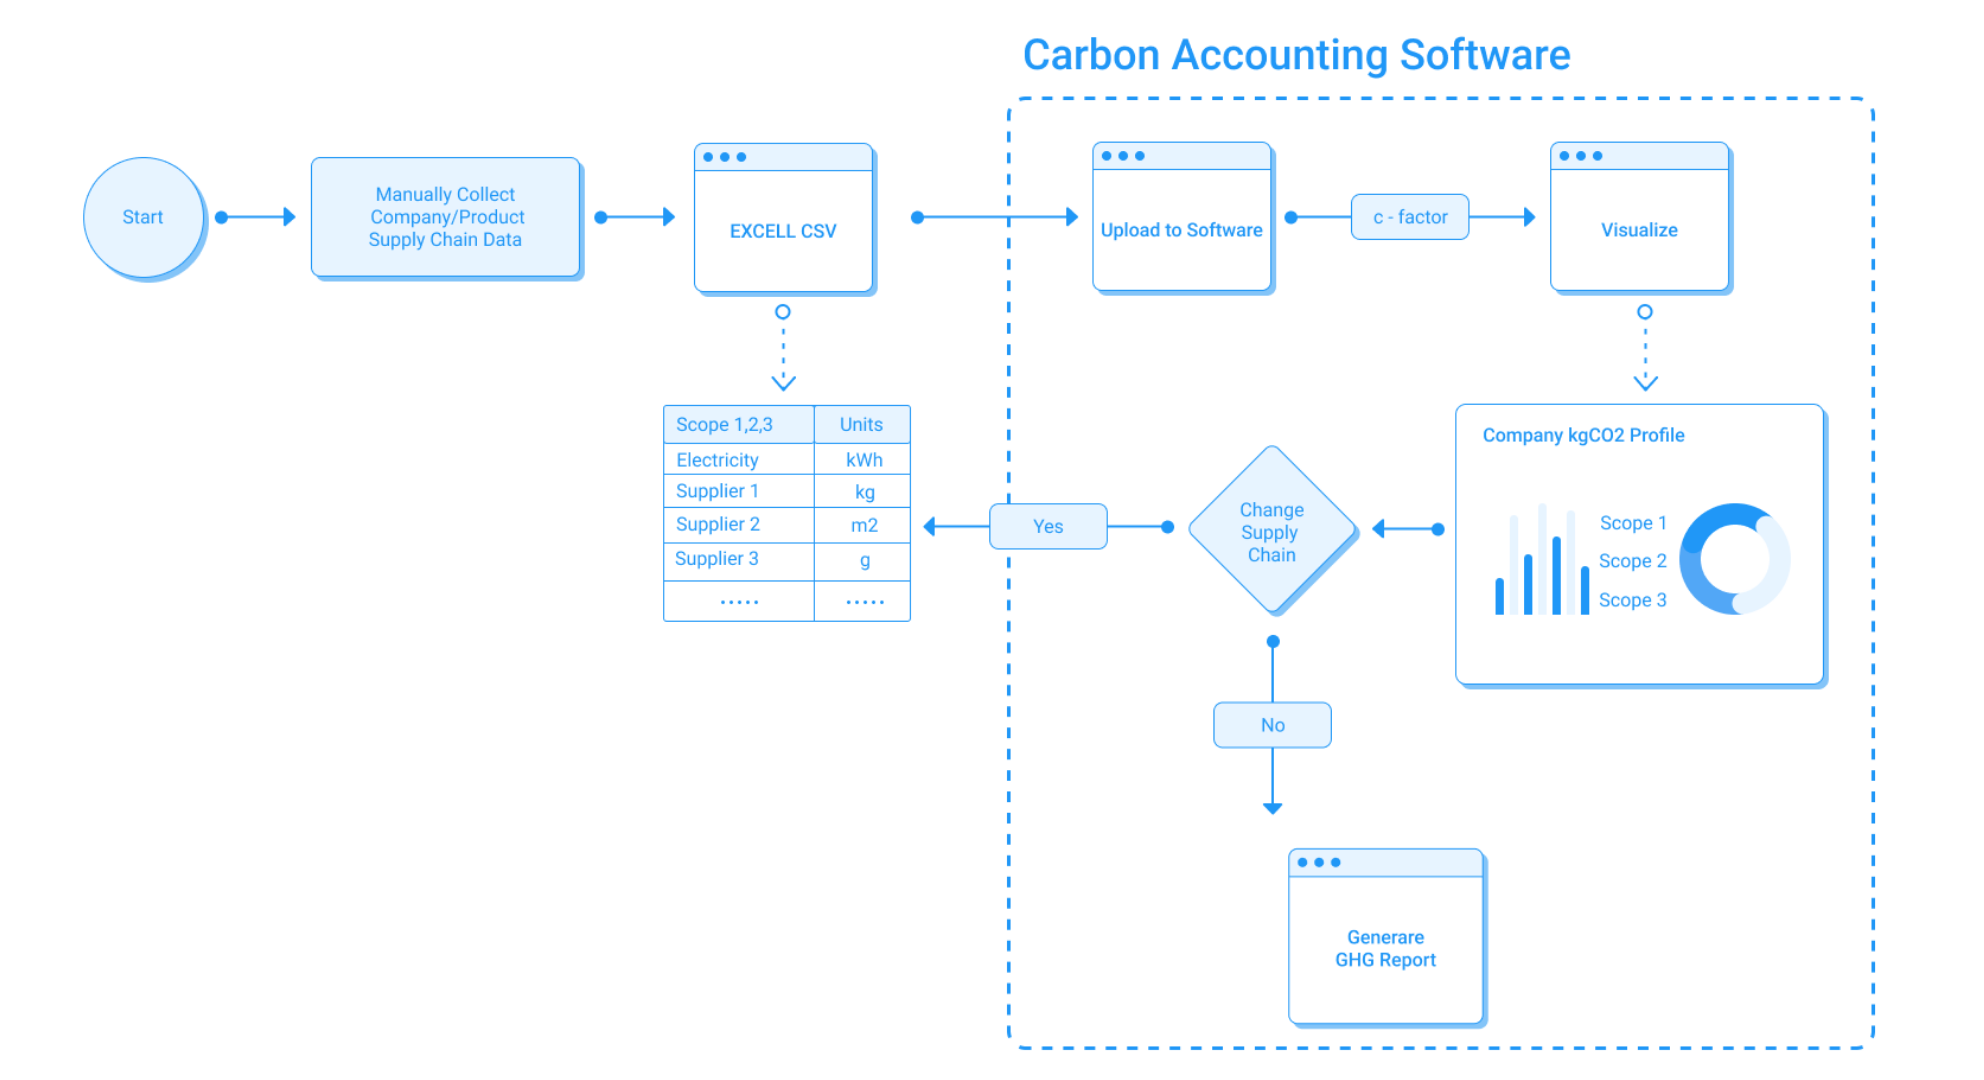
UX Flow before Node Editor
define
Product Centric Approach
After having a clear understanding of the product functionality and needs of CarbonGraph, I proposed recalibrating the focus of the product from being a database for carbon emissions data for products to becoming an interactive web application where companies can build graph networks of CO2 emissions data from each step of the product-life cycle. To address these problems I wanted to design carbon accounting software with "Product Supply Chain" in mind. To allow companies to visualize their supply chain and corresponding carbon footprint within our software.
- • Dynamically generate their carbon footprint data per product in a company
- • Search for suppliers within CarbonGraph data base with minimum emissions
- • Discover and Share carbon footprint data with other companies in a product supply chain.
- • Audit and verify their data with CarbonGraph
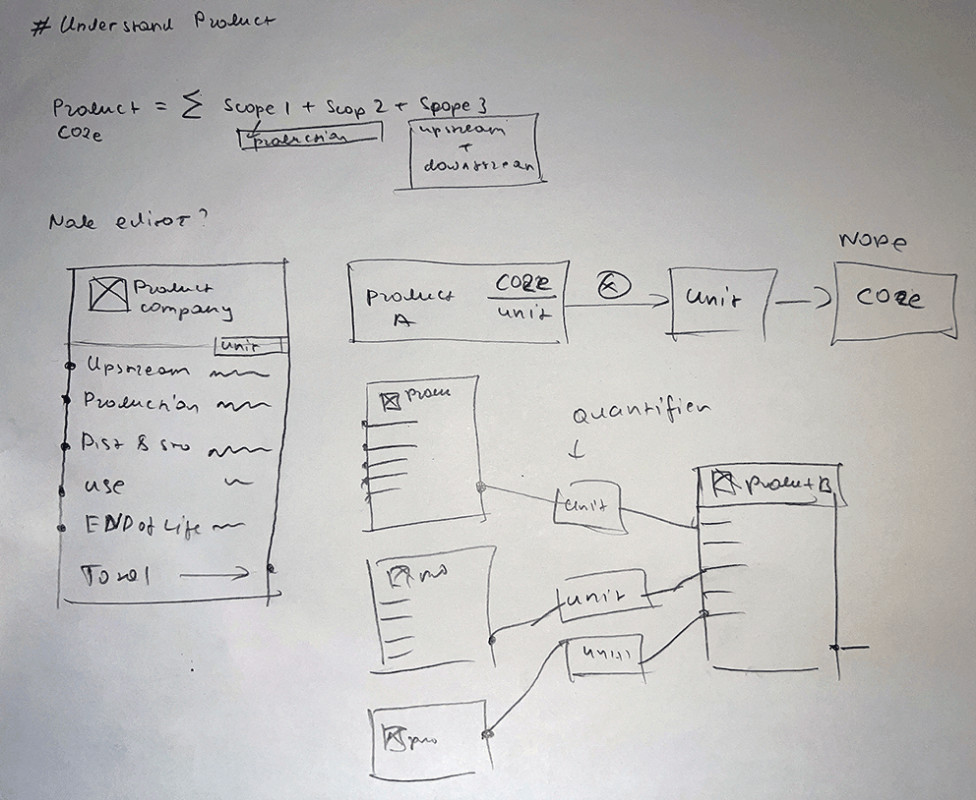
Product lifecycle sketch
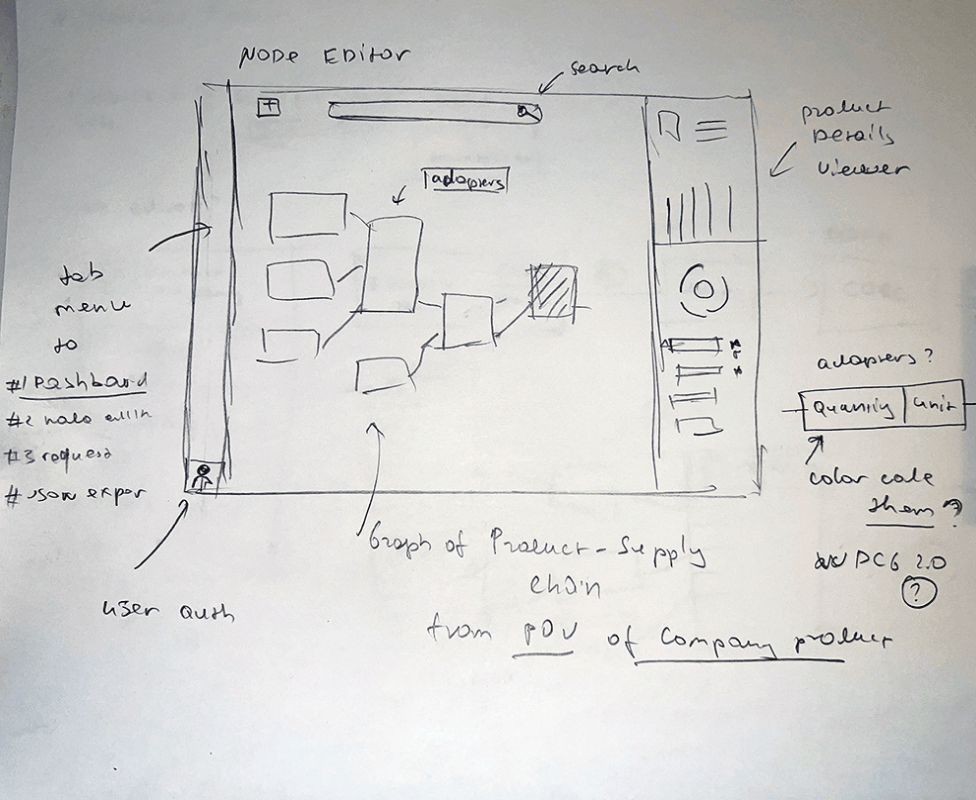
Node editor sketch
UX flow diagram
persona
Meet Sarah Chen, Sustainability Manager

Sarah Chen
Sustainability Manager @ ACME
Personality
Tools & Platforms
Sarah is responsible for tracking and reducing the environmental impact of ACME's consumer electronics. With increasing regulatory pressure and consumer demand for transparency, she needs accurate, verifiable carbon footprint data for their product lines. She manages relationships with dozens of suppliers and struggles to gather consistent emissions data across the complex supply chain.
Goals
- Accurately calculate Scope 3 emissions for key product lines
- Identify high-emission components and suppliers in the value chain
- Streamline data collection from suppliers
- Generate standardized reports for compliance and marketing
- Find lower-carbon alternative suppliers or materials
Frustrations
- Inconsistent or missing data from suppliers
- Time-consuming manual data collection and calculation
- Difficulty visualizing the entire product lifecycle emissions
- Lack of a standardized platform for data exchange
- Keeping up with evolving reporting standards
Behaviors & Habits
- Regularly contacts suppliers for emissions data
- Creates quarterly sustainability reports for leadership
- Collaborates with product design teams on eco-friendly alternatives
- Attends industry conferences to stay updated on sustainability practices
In Sarah Chen's Words
"I spend more time chasing data than actually analyzing it to make improvements."
"We need to move beyond spreadsheets if we want to truly understand our carbon impact."
"Our customers are demanding transparency, but our supply chain is a black box."
This persona is representative of professionals tasked with corporate sustainability and product lifecycle assessment, based on typical industry challenges.
Design Process
Designing the CarbonGraph B2B SaaS Platform
Brand Identity Formation
The name "CarbonGraph" represents the intersection of carbon emissions tracking and data visualization through graph networks. I created a minimalist logo that combines a magnet (representing capture) in the shape of a "C" (the company's first letter) with a CO2 molecule being captured, forming a "G" shape. This C+molecule design symbolizes the platform's core purpose of capturing and analyzing carbon emissions data. The logo serves as the foundation for the entire brand identity, establishing a clean, professional aesthetic that balances scientific precision with user-friendly design.
CarbonGraph Logo: A minimalist logo combining a magnet with a CO2 molecule to represent the platform's core purpose of capturing and analyzing carbon emissions data.
System: Hierarchy established for consistent information display across the platform
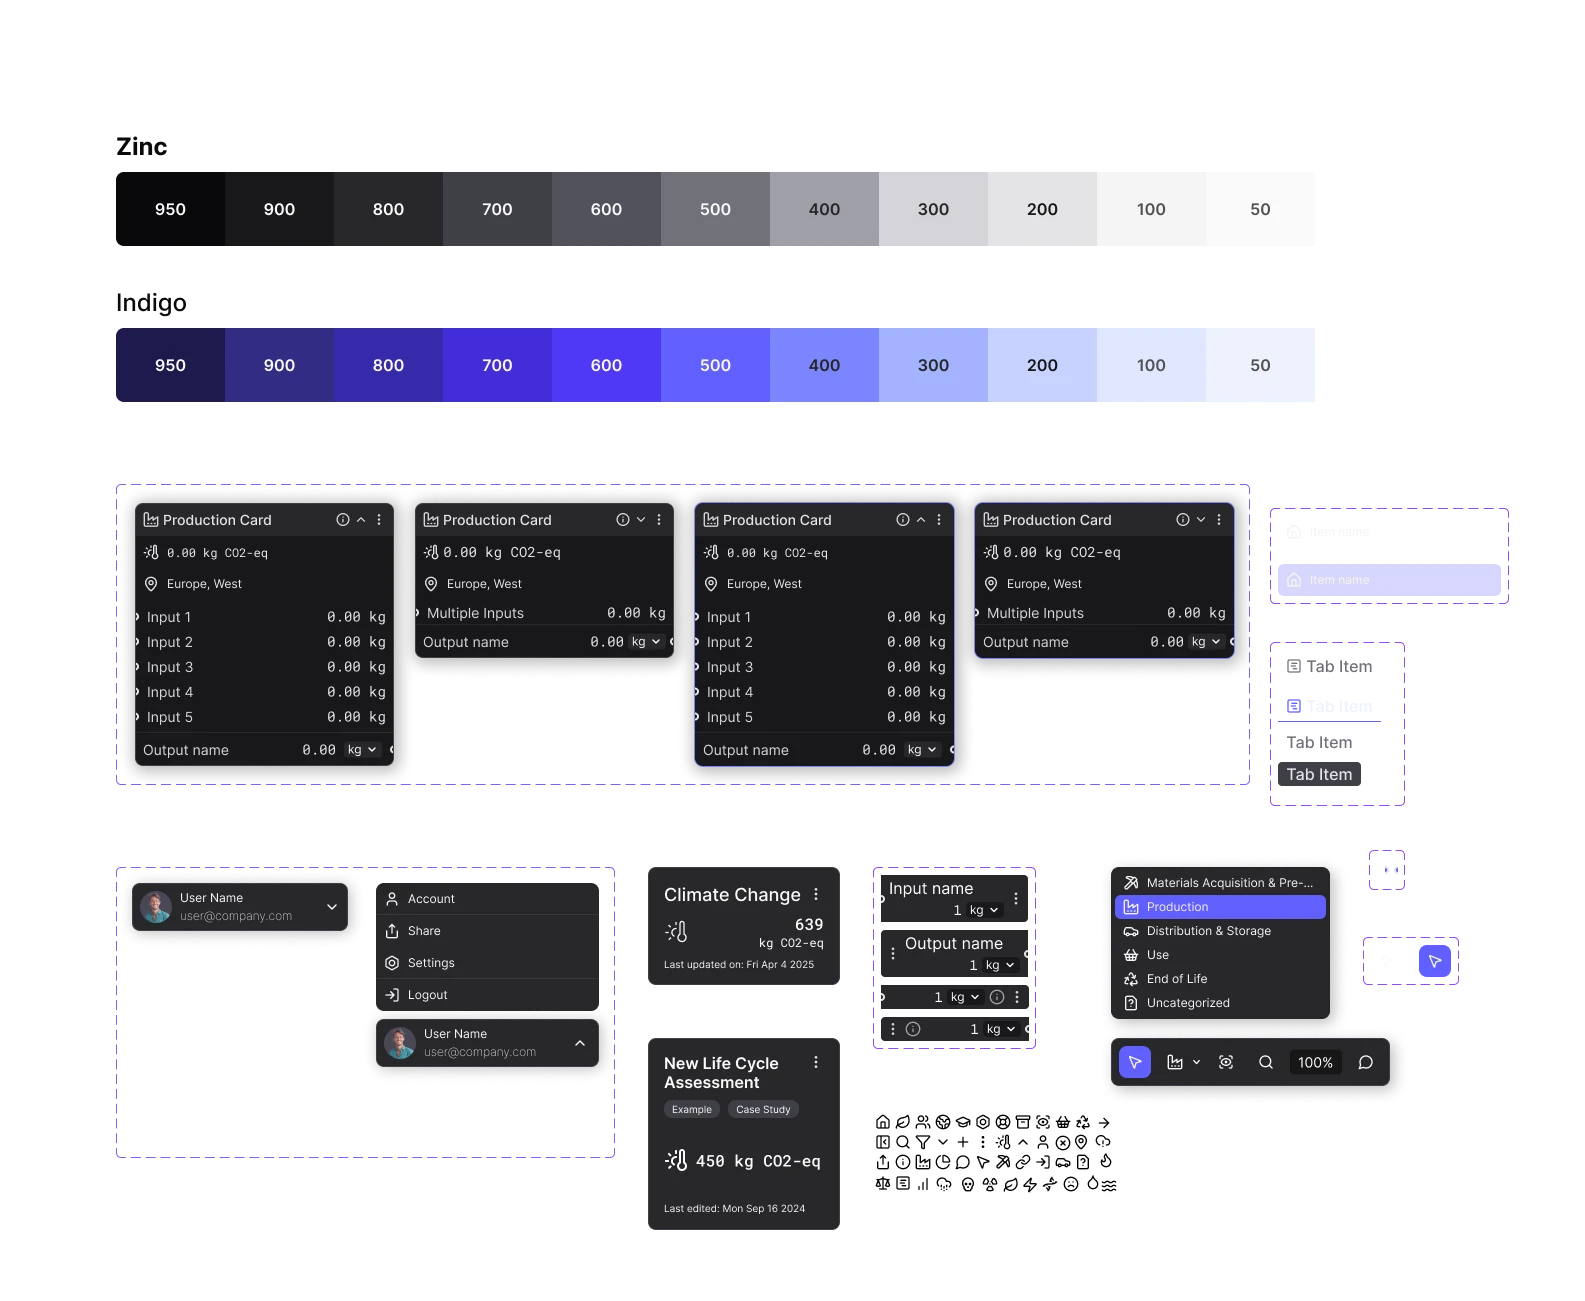
Design System Development
As I was designing the MVP, I formed a component base that would later become part of a comprehensive design system. I used standard TailwindCSS colors (Zinc and Indigo as primary) to help developers prototype the app faster. This initial foundation focused on accessibility and consistency, with a dark/light mode color palette, typography hierarchy, and interaction patterns. The color system used semantic naming with specific use cases for data visualization and status indicators, ensuring clear and accurate data representations across different visual modes.
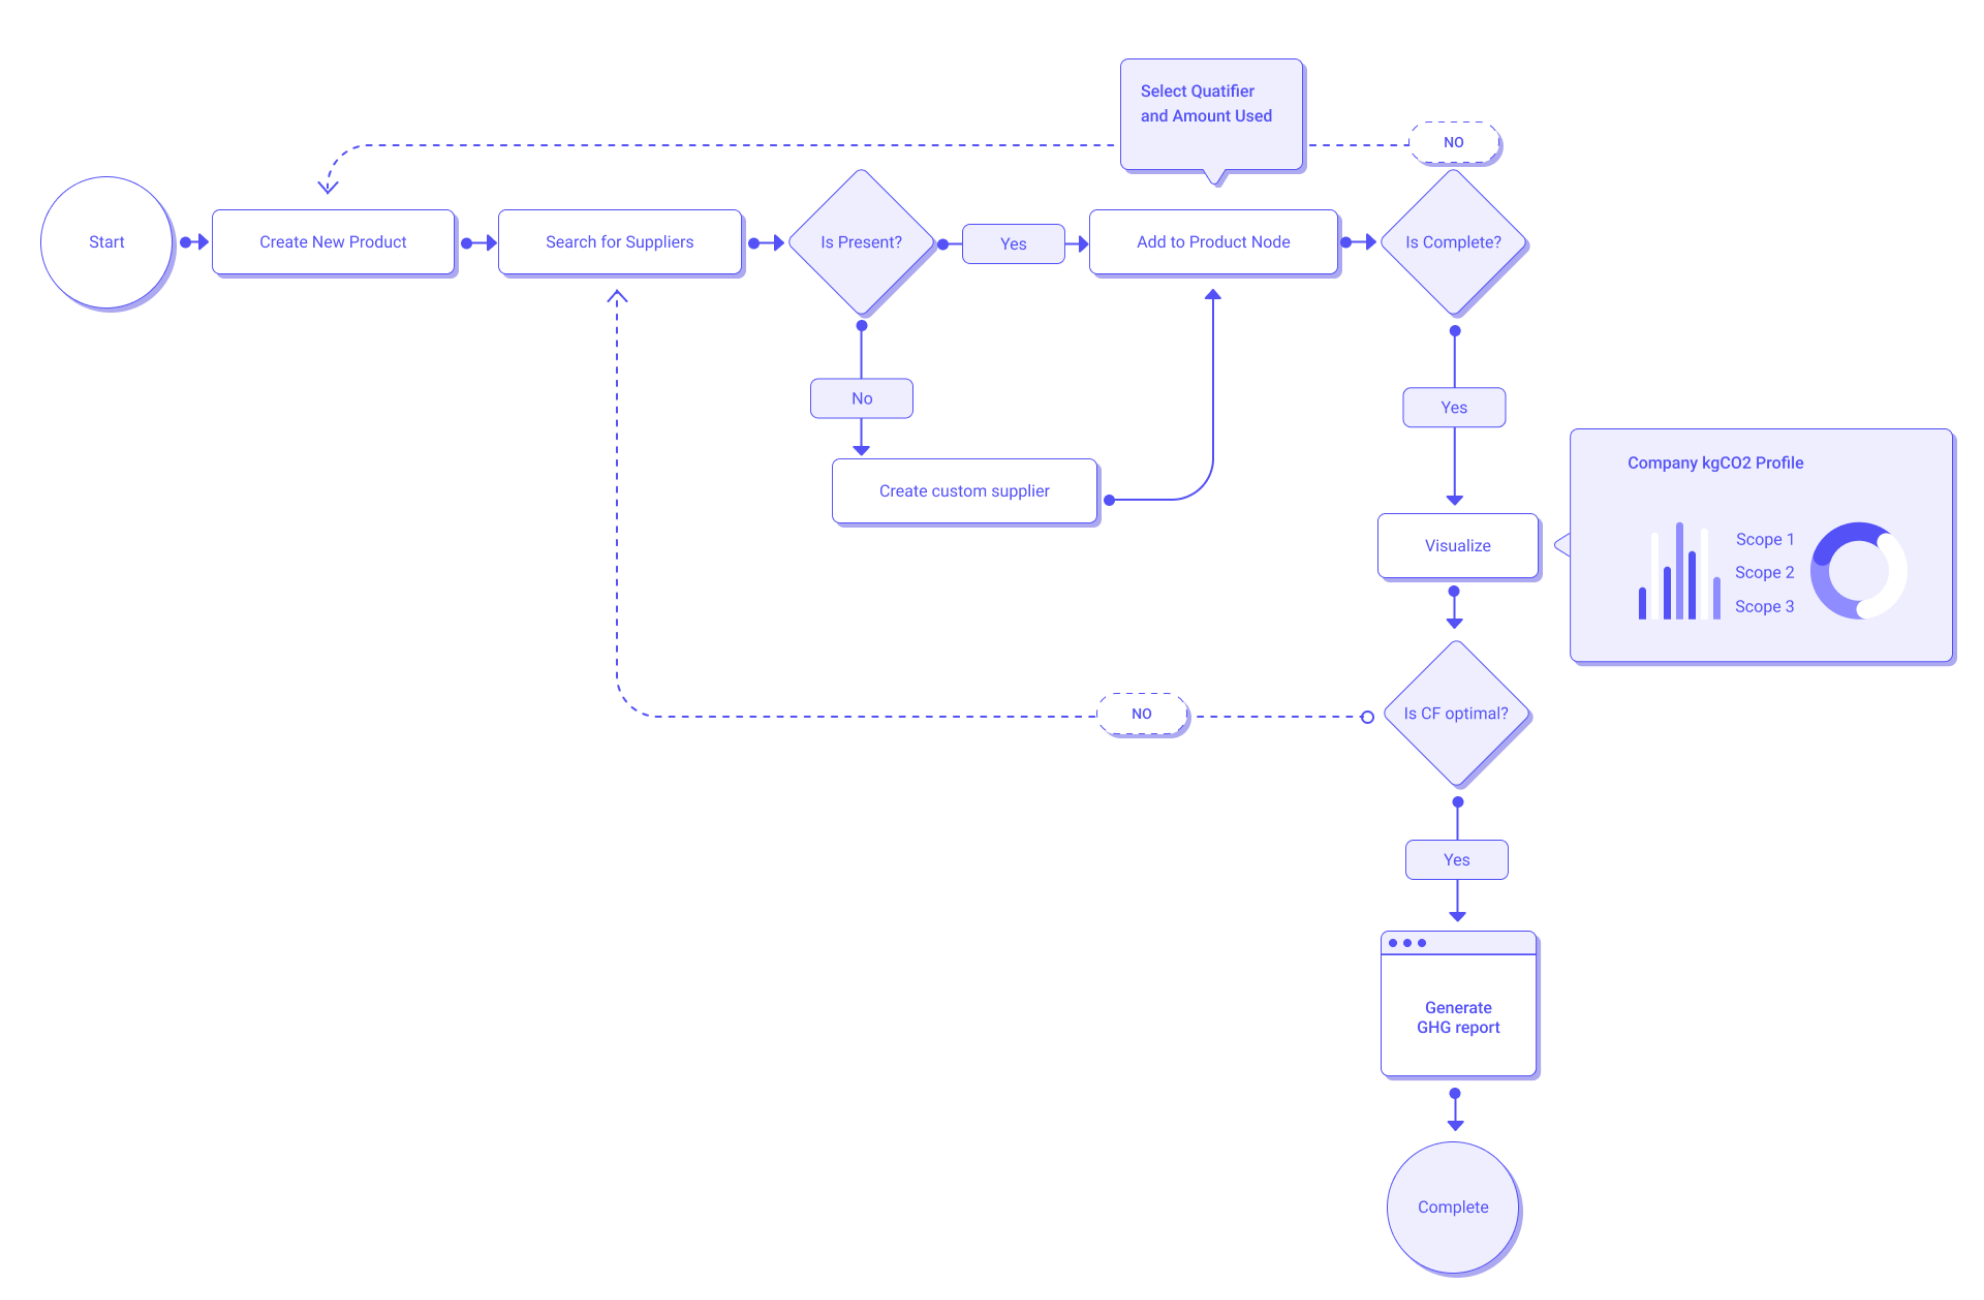
Information Architecture
I began the structural design process by mapping out the Information Architecture for the LCA platform. This involved identifying key user flows, data relationships, and system interactions to create a scalable and intuitive structure. By understanding how users would navigate through the complex process of lifecycle assessment, I created a framework that made advanced carbon calculations accessible to sustainability professionals without specialized technical knowledge.
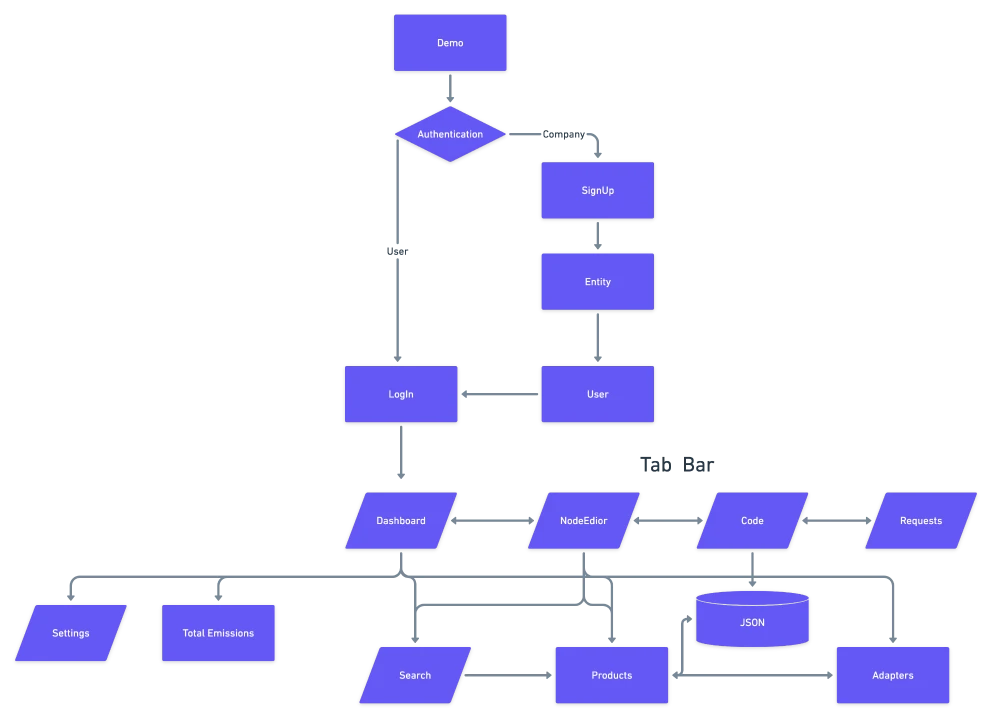
Information Architecture: Mapping user flows and data relationships to create an intuitive structure
Node Editor Interface
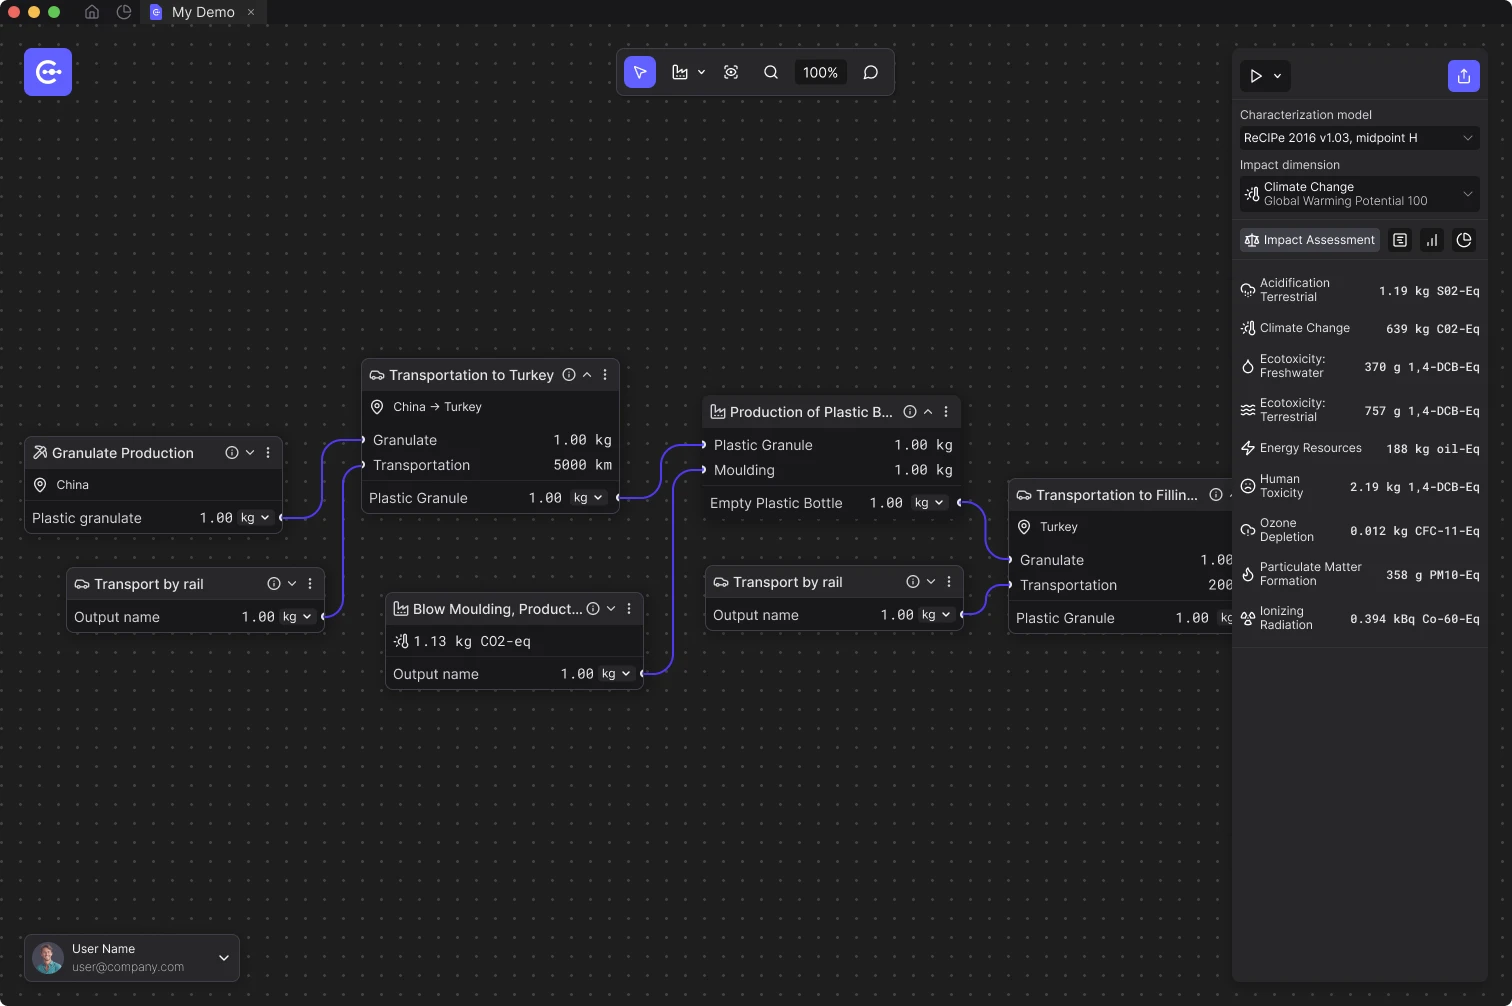
For the MVP, I focused on developing a node-based editor interface that would allow users to visually construct and analyze their product lifecycle assessments. This approach makes complex carbon calculations more accessible and intuitive for users. By representing each step in the supply chain as a node, users can build visual models of their products' environmental impact, allowing for more intuitive data entry and clearer visualization of emissions hotspots.
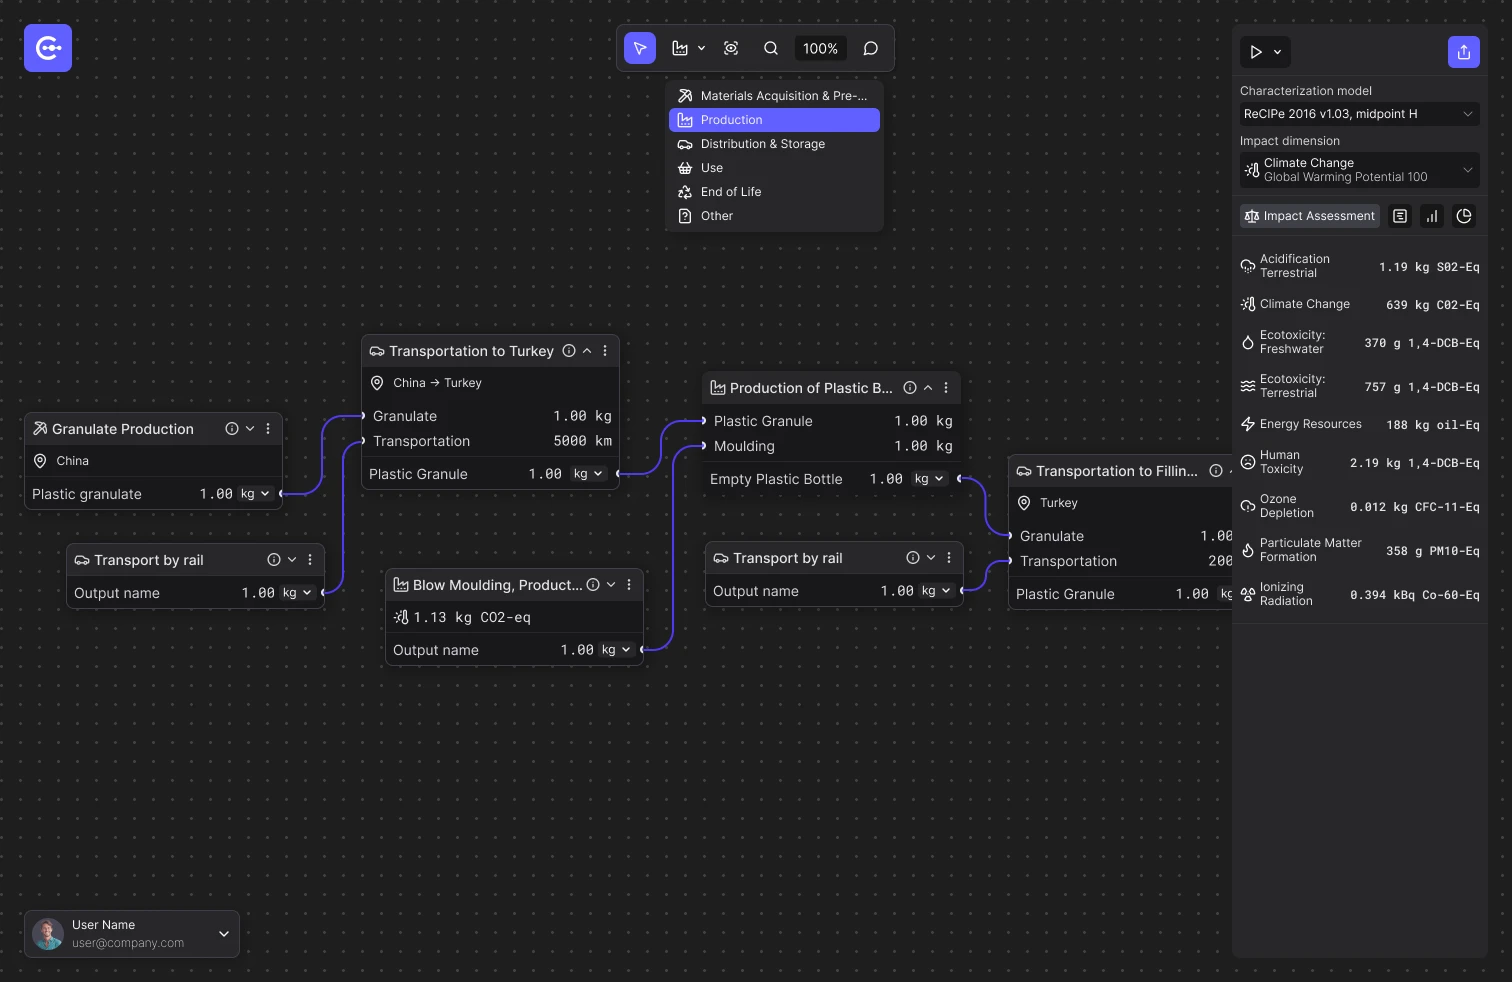
Node Editor Interface: Visual construction of product lifecycle assessment models
Dashboard Design
I designed a clean, modern interface with a focus on data visualization and user experience. The dashboard provides clear insights into carbon emissions across the supply chain, with interactive charts and real-time data updates. This allows sustainability managers to quickly identify problem areas, track progress over time, and generate reports for stakeholders without extensive data manipulation.
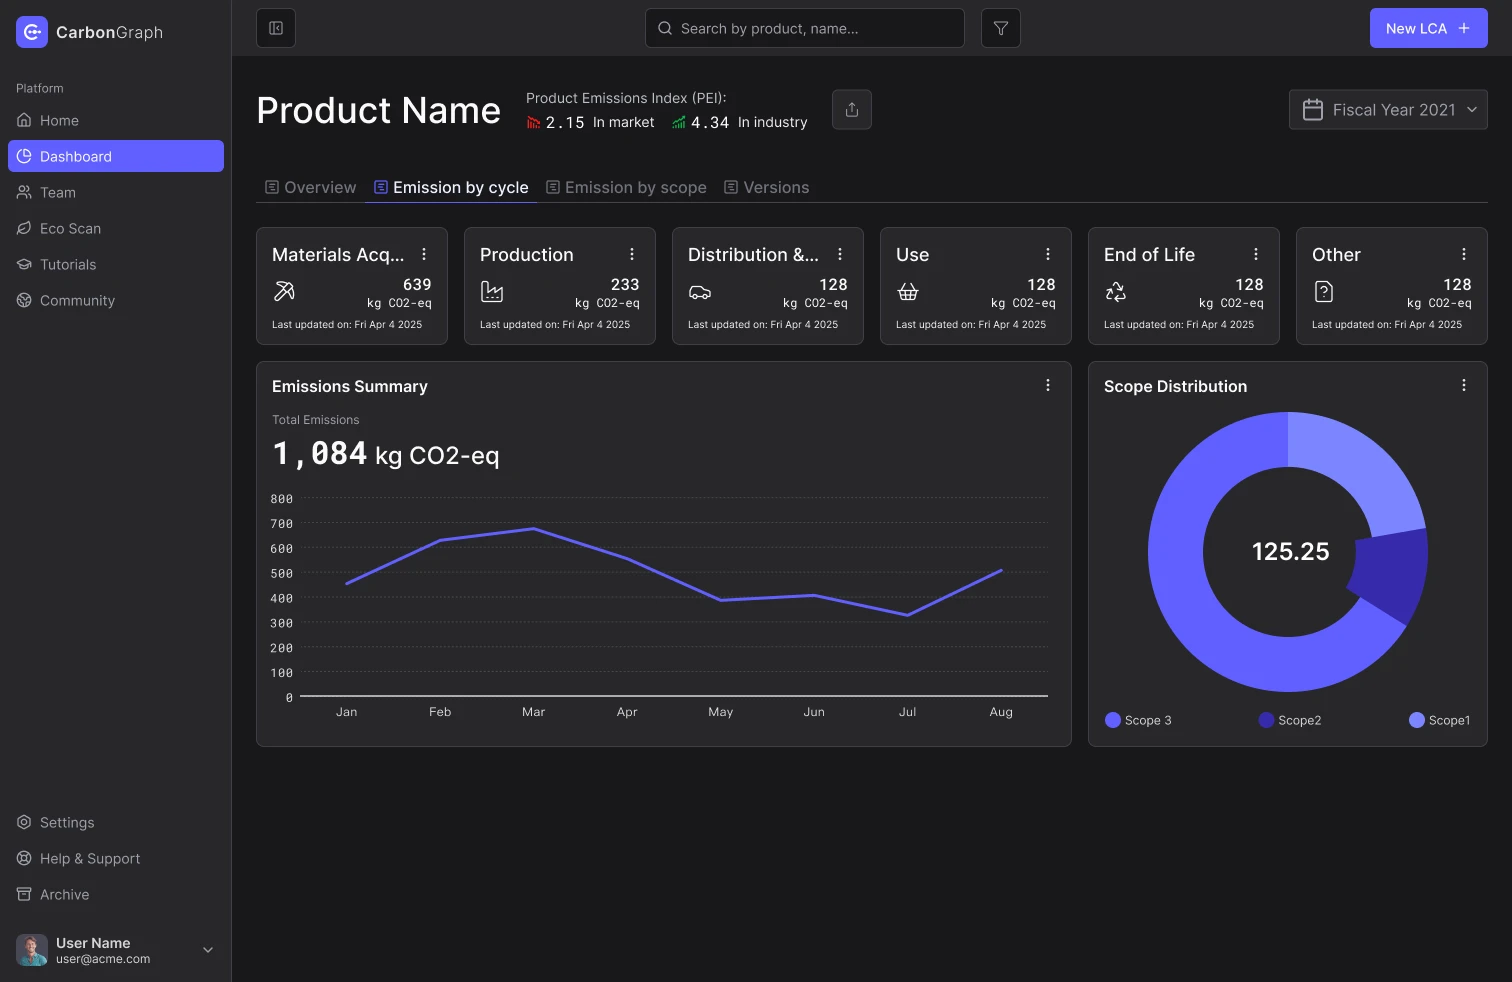
Dashboard Design: Clear visualization of carbon emissions data and insights
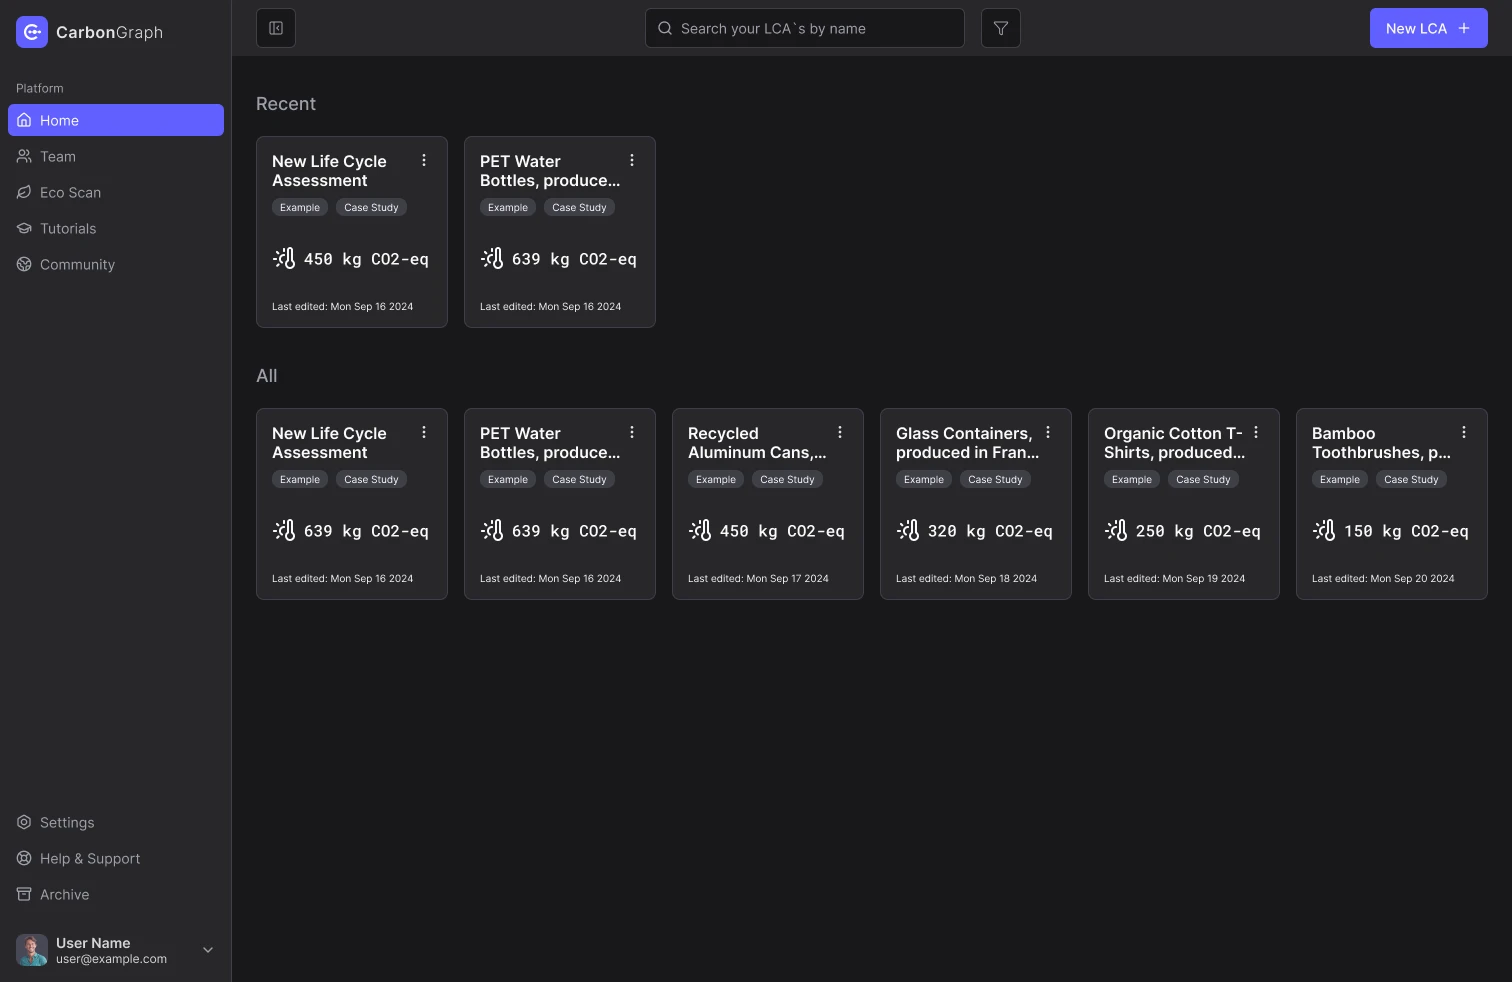
Dark Mode: Home page displaying product portfolio
Light and Dark Mode Implementation
To accommodate different user preferences and working environments, I implemented both light and dark mode versions of the interface. This dual-mode approach enhances accessibility while maintaining consistent information hierarchy and visual storytelling across both modes. Special attention was paid to ensuring that data visualizations remain equally legible and accurate in both modes.
- • Light Mode
- - Higher contrast for daylight working conditions
- - Optimized for printing and sharing reports
- - Familiar paradigm for traditional enterprise users
- • Dark Mode
- - Reduced eye strain for extended analysis sessions
- - Enhanced focus on data visualization elements
- - Modern aesthetic preferred by technical users
Interface Adaptability
The interface was designed to be highly adaptable to different viewing conditions and user preferences, with consistent usability across all visual modes.
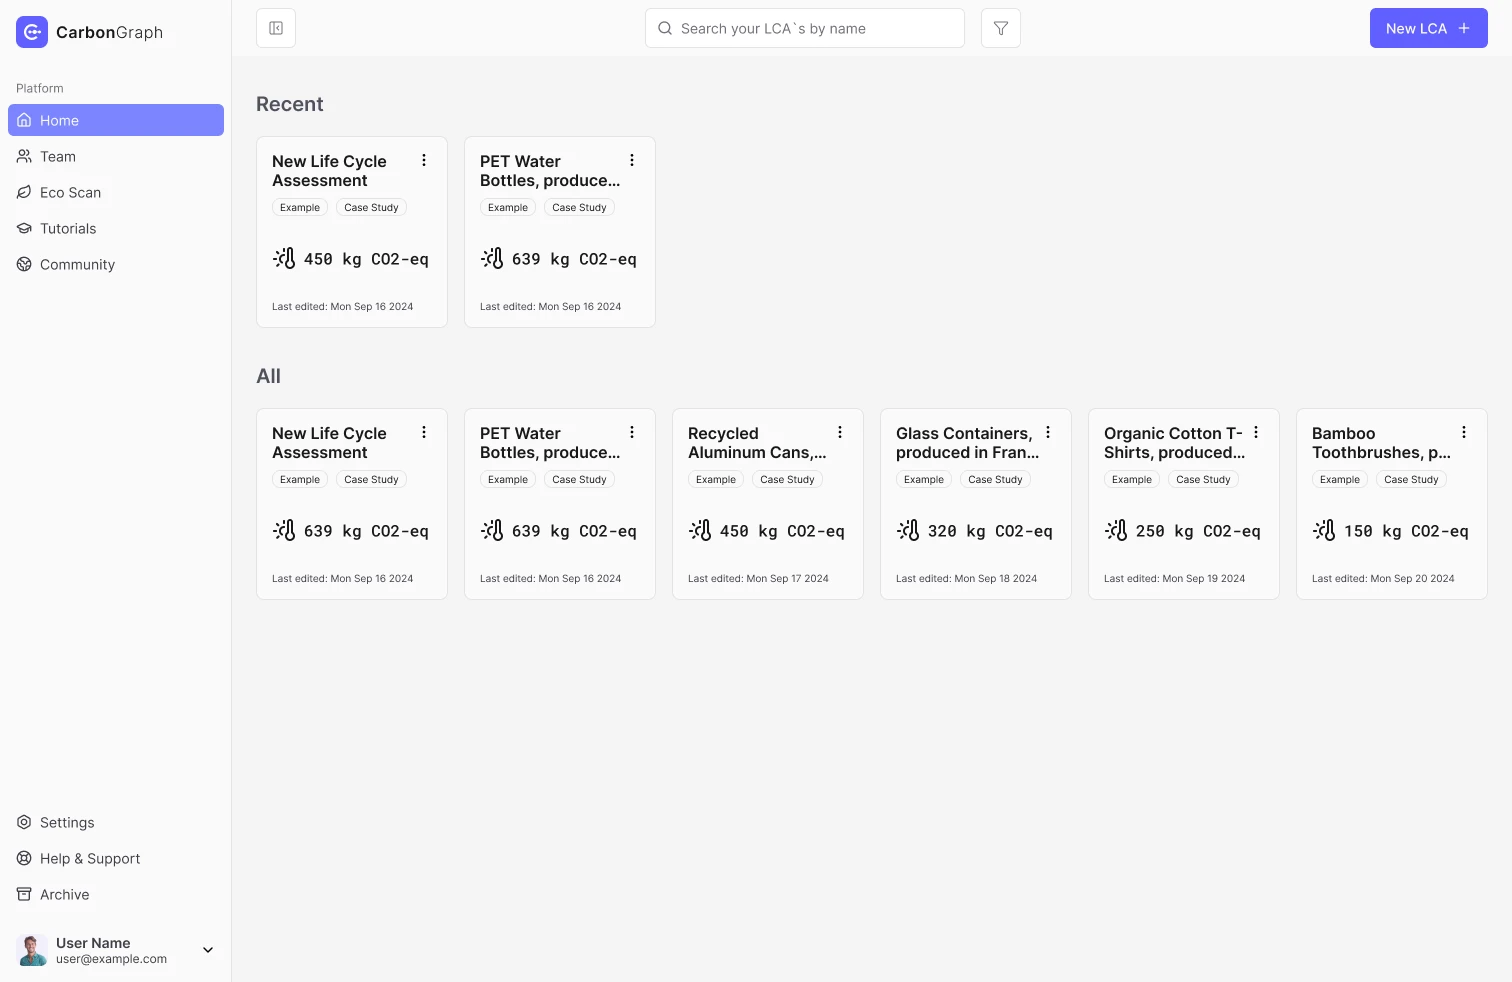
Light Mode: Alternative view of the same interface